

Measure positive behaviour across every school you fund.
One platform, every institution, comparable numbers. Each school runs its own programme, and you get the cross-institution view of participation, hours and impact.
 Every Step Counts

 15
schools, one dashboard
15
schools, one dashboard


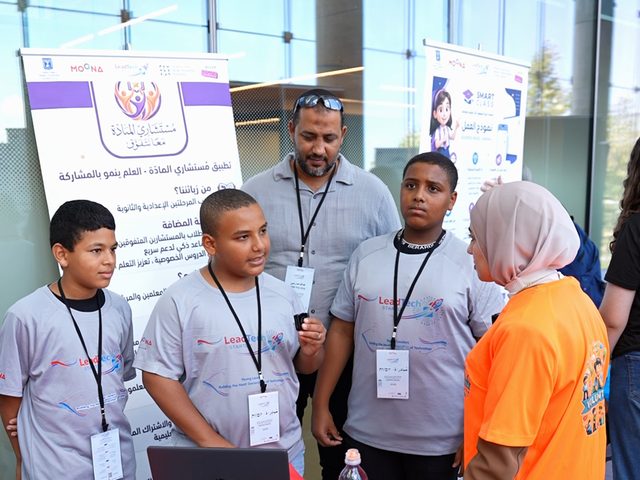
This is what it looks like
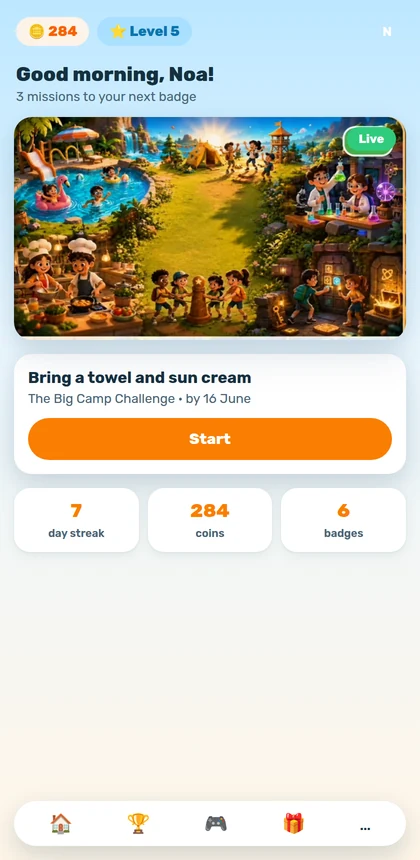
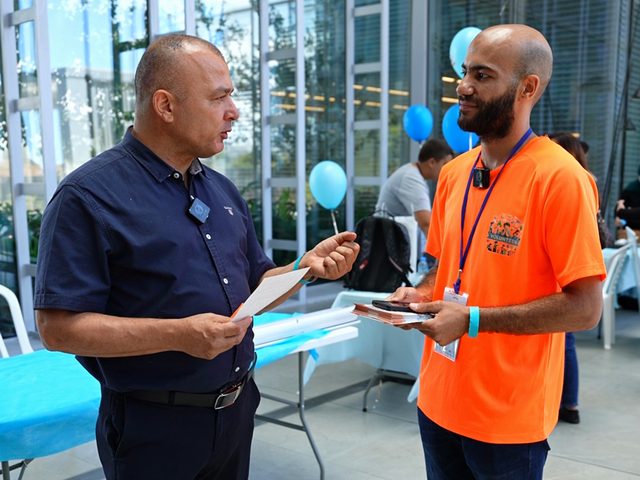
Not a mockup. Real students, real mentors, real events from our schools.
-
The story in half a minute
-
-
-
This is already happening
- 15 Schools
- 2,000+ Students
- 50,000+ Hours of positive action
The gap you already know
-
Programmes that don't report
You fund social activity and get back narrative reports with no data you can compare.
-
Every institution measures differently
Without one definition of participation and hours, there's no telling where the investment works.
-
Pilots that never grow
What works in one school doesn't travel, because there's no infrastructure to reproduce it.
Three steps, and most of them are ours
-
01
You set the targets
Which behaviours you want to grow, and in which institutions. We translate that into measures.
For example, goals schools have already chosen:
- Arriving on time
- Helping others
- Keeping spaces clean
- Learning and homework
- Sport and health
- Belonging and teamwork
- Community involvement
-
02
We stand it up in every school
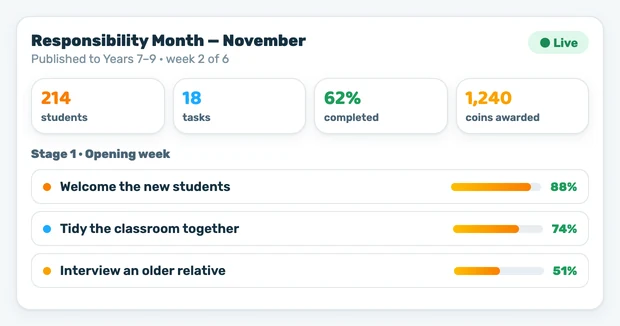
Each one gets its own programme, competitions and rewards — under one set of definitions.
-
03
You see the whole picture
The kids play and complete, and you get the cross-institution comparison in numbers.
Impact you can't measure is impact you can't scale.
And here is what you get
The side parents never see: the tools your staff use to run it, approve it and measure it.
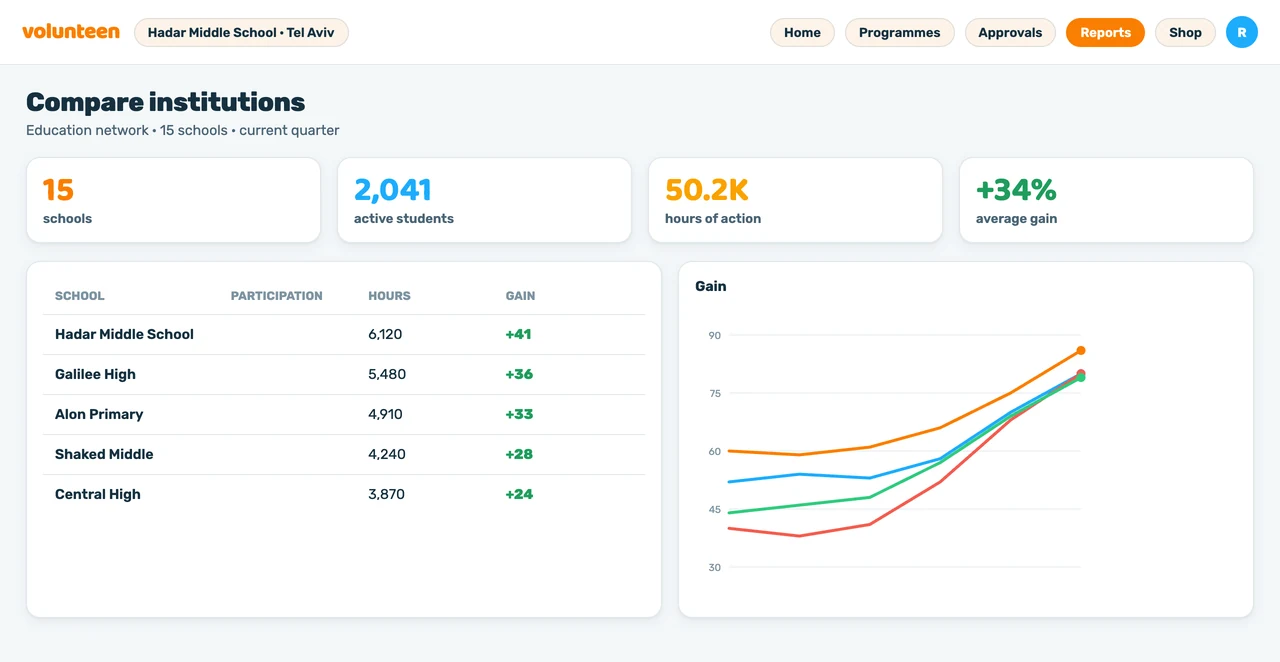
Where the investment is working, in numbers
One dashboard across every school in the network — participation, hours and improvement, under one definition.
- Rank institutions by any measure
- Spot a school that has stalled early
- Export straight into a quarterly report

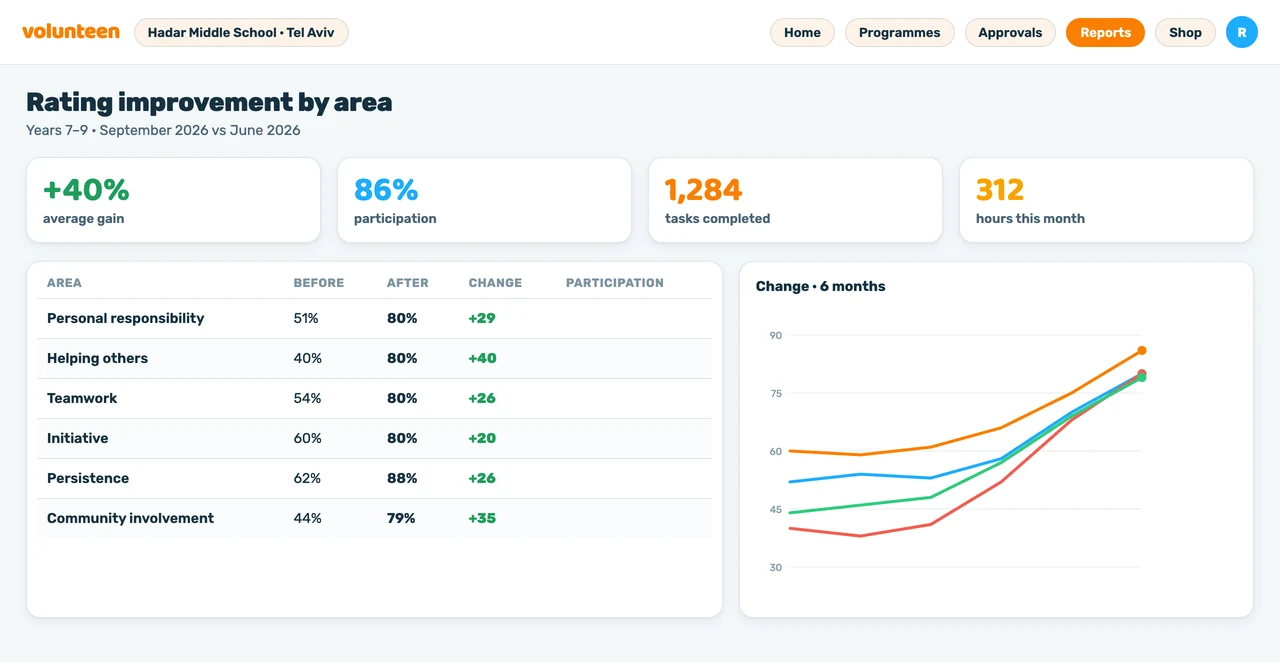
The same definition in every school
Participation, an hour and a rating are defined by the system, not by each institution. What differs is content, not the unit.
- Identical measures across institutions
- Cut by age, area and region
- Aggregates only — no student detail
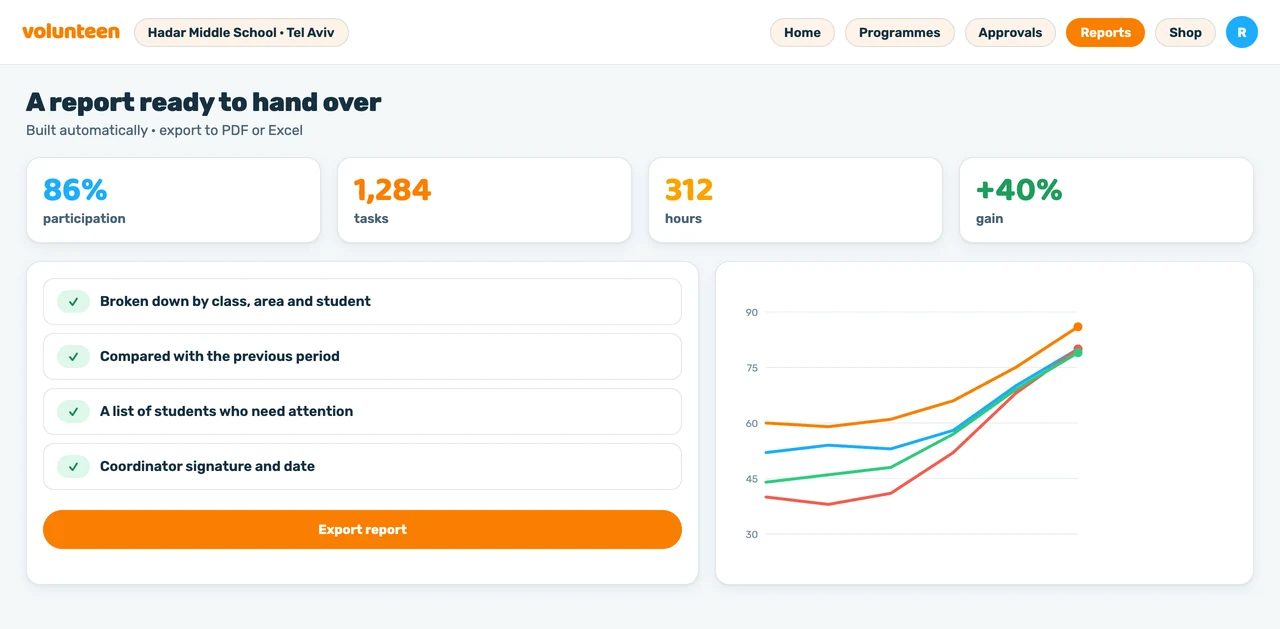
What they asked for, already built
A quarterly report that assembles itself, with a comparison to the previous period and a cut per institution.
- PDF or Excel in one click
- An appendix per institution
- Shaped to reporting requirements

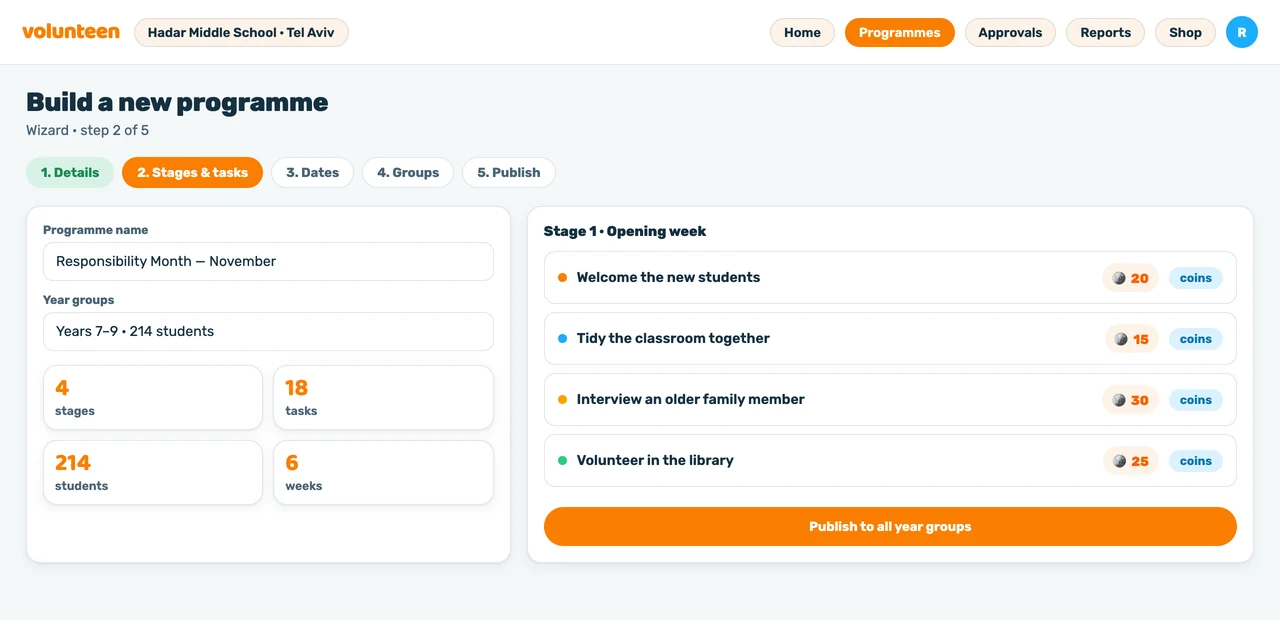
Two weeks from decision to running
Each new school gets a programme, a team and its settings — and we stay with them through month one.
- Templates that already worked in your network
- Coordinator training at every school
- The same measurement definitions from day one
One minute and it clicks
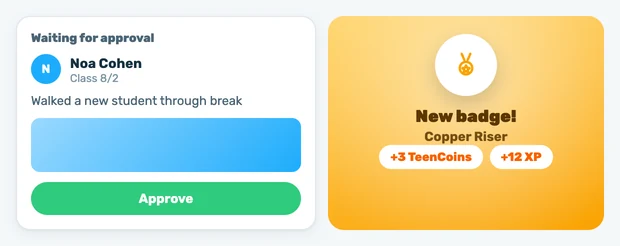
Straight from the app: a student gets a task, does it, submits proof, earns a badge.
- You set the targets — Which behaviours you want to grow, and in which institutions. We translate that into measures.
- We stand it up in every school — Each one gets its own programme, competitions and rewards — under one set of definitions.
- You see the whole picture — The kids play and complete, and you get the cross-institution comparison in numbers.
From what exists to what's possible
Today
- Narrative reporting
- Different definitions per institution
- No comparison between schools
- A pilot that stays a pilot

With Volunteen
- Uniform data from every institution
- A cross-institution dashboard
- Activity templates you can reproduce
- Rollout support for each new institution
What that enables
- Decisions grounded in data
- Reporting to your funders
- Controlled expansion
- Impact you can show
What you'll want to establish
-
How do you make data comparable across different schools?
The definitions of participation, an hour and a rating are identical across institutions and set by the system, not by each school. What differs between institutions is the content of the activity, not the unit of measurement.
-
What about protecting minors' data?
Data is held at institution level and permissions follow role. The cross-institution view shows aggregates; an individual student's details are reachable only by their own institution's staff.
-
Can we start small and expand?
It's what we recommend. Start with a few institutions against agreed measures and expand once there are results. We scale with discipline, not on speed alone.
How to start
-
1
An intro call
We establish which institutions are in scope and what you need to measure.
-
2
A multi-institution pilot
We set several schools up together, under the same measurement definitions.
-
3
Review the results
After an agreed period we sit down with the data and decide on expansion.
Let's test the fit
Leave your details and we'll come back with a sample cross-institution report from the system.

Got it, thank you!
We'll come back to you within one working day. If it's urgent, send us a WhatsApp.